When my son Patrick joined the U.S. Army and was selected for aviation training, he faced a daunting challenge. After a year of intense instruction, he emerged certified to fly Blackhawk helicopters.
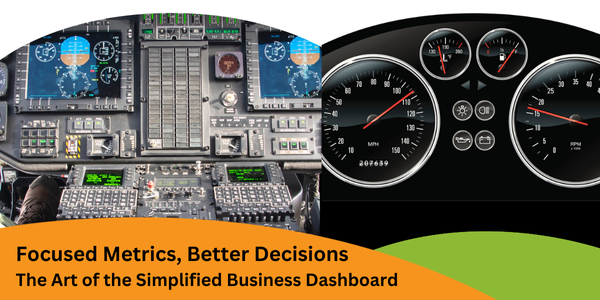
When he stepped into the cockpit he was surrounded by dozens of indicators, gauges, and controls in a complex array. Only his specialized training could prepare him to process the information. After hundreds of flights over seven years, Captain Stein completed his Army career safely and successfully.
In contrast, when we step into our cars, we only see essential indicators like speed, fuel, and temperature, despite the complex systems beneath the hood. This deliberate simplicity lets us amateur drivers focus on what matters most: arriving safely at our destination.
The Business Dashboard Dilemma
Business leaders face a similar challenge with performance metrics. Without careful curation, we risk creating military helicopter-level complexity when we need family car-dashboard clarity.
The Profit Soup team has long advocated for business dashboards to monitor performance, focusing on:
- Key drivers that help achieve your goals
- Understanding the distinction between leading indicators (activities driving success) and lagging indicators (measurements tracking results)
But here’s the crucial insight: Your dashboard must be selectively curated. Unless you’re flying military sorties, the rule is simple: less is more.
Your Five-Step Dashboard Simplification Process
- Choose priorities for your month, quarter, and year
- Identify target results for your financial goals (lagging indicators)
- Select leading indicators that measure your success drivers (KPIs)
- Set activity goals for your chosen leading indicators
- Curate Your Vital Few Metrics that support and align with Steps 1 through 4
Implement With Discipline
The metrics you select should align with your current priorities and business model and evolve as you achieve goals or shift focus. Resist the temptation to track everything at once. Here are some possible metrics from which to choose.
Revenue & Margin Indicators
If your priorities are growing sales and profit margins, you might choose from metrics like these:
- Leads, conversion rates, and average deal size
- Staff costs and labor efficiency
- Overtime hours
- Contribution margin (percentage of revenue left after paying variable costs)
- Magic number (revenue increase needed to cover each dollar spent on new investments)
- Gross Margin Return on Inventory (for product businesses)
- Gross profit per labor hour (for service businesses)
Cash Flow & Liquidity Indicators
If your priorities are improving cash flow, consider financial liquidity and efficiency metrics like these:
- Days to Invoice (billing efficiency)
- Accounts Receivable Aging (collectability of outstanding invoices)
- Inventory Turns (how quickly inventory converts to sales)
- Current Ratio (short-term financial health)
- Days Cash on Hand (runway for operations)
Operational Foundation Metrics
Less strategic than the above drivers, but if you don’t get these right, you won’t make progress on your overall objectives.
- Customer satisfaction scores
- Loyalty program engagement (if applicable)
- Safety incidents
- Employee turnover rate
An Industry-Specific Example
Sandy and her partner own a caregiving business that requires a steady supply of families who want in-home care for their loved ones and qualified caregivers ready to provide it. This year, they want to grow their client base to include care centers. She and her team selected these metrics for the first quarter based on their priorities and goals for the year.
Client-Side Metrics
Billable Hours – Key Lagging Indicator on the Client Side
Supporting Metrics
- Marketing Visits – visits to prospective institutional clients
- In-service Training Events – complimentary training for care center caregivers
- Client Inquiries – website responder, referrals, emails, inbound calls
- Inquiry to Assessment Conversion – percent of inquiries resulting in a Care Assessment meeting
- Care Assessment Meetings – last step before client agreement finalized
- Assessment to Client Agreement – percentage of care assessments that resulted in clients
- Number of Active Clients – total clients who received services during the period
- New clients – Number of new clients – residential and care centers
- Client reviews – New reviews on Google Business Profile and Care.com
Caregiver-Side Metrics
Available Caregivers – Key Lagging Indicator on the Caregiver Supply Side
Supporting Metrics
- Caregiver Inquiries – number of calls from prospective caregivers
- Care Giver Interviews – number of interviews scheduled and completed
- Hire/Interview % – percentage of interviewed candidates hired
- Caregivers Scheduled Percentage – percentage of caregivers on the bench scheduled during the period
- New Caregiver Idle Days – number of days before a new caregiver is scheduled for their first shift
- Average Hours Per Scheduled Caregiver – caregivers on the bench divided by hours worked in the period
Operational and Financial Metrics
- Average Revenue per Client – bi-weekly revenue billed divided by active clients
- Gross Profit Margin –percentage of each revenue dollar remaining after paying for caregivers and consumable supplies
- Accounts Receivable Average Collection Days – how long it takes to collect from clients
- Quality Assessments – number of quality-of-care assessments completed
- Unbilled Overtime – number of hours of overtime completed but not billed to clients
Sandy and her partner are also committed to completing their financial statements by the 15th of each month, allowing them to conduct timely financial reviews.
Two Guiding Principles:
- Focus on the Vital Few, Not the Trivial Many
The Pareto Principle reminds us that roughly 80% of outcomes come from 20% of causes. Your success depends on identifying and monitoring the vital metrics that truly drive results. - Create Regular Accountability
Establish a consistent schedule for your team to review these focused metrics. Celebrate wins, address shortfalls immediately, and keep meetings efficient and action-oriented.
Your Next Step
Review your current dashboard. Does it resemble a complex helicopter cockpit with dozens of indicators, or a streamlined car dashboard showing only what’s essential for the journey? Choose simplicity and watch your team’s focus—and results—sharpen accordingly.